How Fashion Brands Can Optimize Inventory Season to Season

Introduction
Each season, fashion retailers are faced with consistent challenges. Namely, anticipating changing trends in a competitive and dynamic retail market. How do you aptly manage stock and supplier orders beyond a crystal ball and crossed fingers? Ensure you have enough of one item but don’t order too much of another, leaving you to discount dead stock and lower your margins?
Through the use of more specific merchandise categories, season codes and product attributes you can closely monitor stock and sales trends.
When combined with sell-through reporting, product data management allows easier identification of product performance. This allows you to have more precise control of your business and enables you to stay competitive.
You’ll learn:
- How and why you should add season codes to your inventory
- The best way to use merchandise categories and product attributes to provide better analysis and control.
- The best way to adjust your inventory strategy in line with changing trends and market intelligence.
- When discounting has to be done, how to ensure you can still maximise the revenue opportunity.
The Advantage of Season Codes
Keeping tight control of your stock investment each season relies on you having a handle on the age of your inventory and your commitment.
Applying season codes to each product before your season starts and before you go to market allows you to have better visibility of your inventory in season, pending orders from suppliers and sell-through levels.
Firstly you need to ensure your season codes names are easily recognisable. The best naming convention is to add your season plus the year. For example:
Spring Summer plus year = SS15
Autumn Winter plus year = AW15
You may have products which run every season and you can code these as ‘core line’. Your core garments would be considered the part of your product mix that’s carried through each season, be it a white button-down shirt, a basic black skirt, or a line of jeans.
Depending on your clientele, core pieces could be a large part of your business in terms of sales, but a smaller number of lines. It is commonly said that your top 20% of products generate 80% of your profit – your core lines make up this 20%.
Analyzing your inventory
Start this process by running an inventory report and sales reports to determine which products should be assigned which season codes.
If you still have inventory left from older seasons and you are not planning to run the items forward, keep their historical season code so you can exclude them from daily or weekly reporting. This will also allow you to track year-over-year sales statistics and filter weekly reports by season.
TIP:
Working with your suppliers more collaboratively will ensure you can reduce your cash investment whilst being able to add new or experimental lines into your product mix. Try asking for smaller minimum order quantities on untested lines and push suppliers for free samples or sale or return. Doing this should help you to grow your orders, which will in turn boost your suppliers orders.
Merchandise Categories and Product Tagging
Sales performance of apparel items each month is best monitored and fine-tuned by intelligently breaking products down through clear merchandise categorisation.
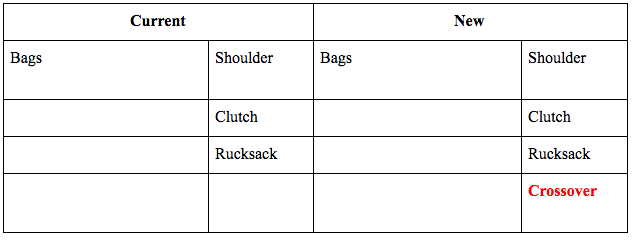
For example, you’ve done your research and you believe crossover bags are such a significant part of your bag business that it makes sense to create a new subcategory to differentiate it from other styles easily within reports and filters.
In addition to this you may have fallen in love with fringed bags. For inventory management, since this is a trend, you do not need to create a category as it may only last one season. You can however create a “tag” or “product attribute”.
By creating a tag called ‘fringe’ you can attach this to any of your fringed products irrespective of which category they are in. You can then look at these products as groups to see how your fringe trend is performing and what action you may need to take based on this.
TIP: To support the sale of your more on trend items, tap into related media stories from major publications and repost into your Instagram, Facebook, Twitter and Pinterest social channels. Write a blog post around a holiday trip featuring the skirt, or capture pictures of fashion trends taking place on the streets outside your shop. Relate this content back to your in-store displays and include them in your ‘recommended’ items online for upsell opportunities.
Utilizing not only subcategories but season codes and applicable products tags will provide more granular metrics when running your sales performance and inventory reports. When you gain more specific insight into what your customers are snapping up and what they’re leaving on the shelves, you’re able to:
- Increase the profit made from every dollar invested in stock
- Ensure your product mix takes into account new trends
- React quickly to slow moving products, liquidize your investment and test new experimental lines in their place.
Using Data Intelligence to Manage Inventory the Smart Way
There is a reason we can’t escape the data conversation: numbers don’t lie. When used smartly and consistently, data reporting can empower you to manage your inventory flow and optimize sales performance efficiently, ensuring your fashion business has the right items people want, at the right time.
Accessing and combining various data points, including business reports for in-store and online operations, along with web and social media metrics, can be a complex and time consuming process.
However, we believe that there are a number of key metrics which can provide quick wins and have detailed below exactly how these can be produced (in as few steps as possible):
Sell-through reporting.
This is typically performed the first day of each month to gauge sales movement for the previous month by exporting the month-end inventory report and sales report, and then combining the two in Excel.
Ideally you want to see your season to date sell through so you can run one sales report from the beginning of your season and join to your stock levels in Excel.
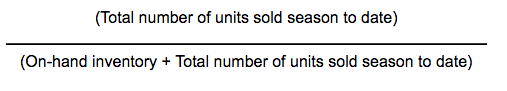
Season to date sell through:
This will provide you with a % of stock you have sold through, those lines less than the average or your planned sell through should be targeted for promotions.
Those higher should be repeated if lead times allow.
Through analysing this valuable data – segmented by seasons, categories, and product tags – you can review the success of purchasing strategies and corresponding marketing campaigns.
By combining sell through percentages with accurate Cost of Goods Sold (COGS) information, you are able to compare profit margin with sell through rate to decide where action needs to be taken and how much discount you can afford to offer whilst remaining profitable
Cohort analysis such as this can show you fast moving/high margin products which should be invested in further, as well as highlight slow moving/low margin products which carry the highest risk as you have the least room to discount.
How a data driven approach to discounting can increase profit and refresh your collection
When discounting is used wisely, sparsely and strategically, it can not only result in additional sales but increased customer engagement.
As a fashion seller you rely on end of season discounting to increase footfall (physical or virtual) to deliver revenue and liquidate stock so you can start to buy new lines for the next season.
However, we should not always rely on end of season sales to shift slow moving stock. We cannot predict which lines will be popular with sale shoppers, how heavily you may have to drop your prices, or the weather on sales weekends (unless you are e-commerce only).
To ensure profit is maximised and you are able to get close to 100% sell through, we recommend using data to single out low margin and/or slow moving lines early in the season. Once you’ve highlighted these lines try the following ideas:
Shopping cart abandonment.
Having a remarketing campaign connected to your items still waiting in a customer’s cart gives you an opportunity to follow up with a friendly email that’s engaging and helpful. Maybe they had a technical issue, or they have questions about delivery or taxes. This first email let’s them know you’re there to help.
If there’s no response after the first email, sending a second one within 30 hours or so of the first email and offering a discount or free shipping may help to nudge them into a completed sale.
As you calculate other aspects of your business, pulling the following numbers will enable you to monitor the success of these remarketing campaigns and the revenue they generate:
- Email open rates for the first email and for the second
- Recovery rate between the first email and the second
- Compare average original cart value to average recovery value to determine if customers purchased all or some of the items in their abandoned cart
- Average discounts per order from the second email compared to average recovery value per order
Loyal shopper discounts.
These are the customers you’ve identified as consistently buying from you, or who belong to your loyalty program and have hit certain sales milestones. Show your appreciation by offering them a free or discounted item, especially if it can be tied to bringing them back for repeat business. Take note of their shopping habits when narrowing your discount offers to certain categories, especially if you sell to both men and women.
Social media promotions or surveys.
This is where you use the discount carrot to entice participation in a word-of-mouth social campaign or when you seek their feedback on a new product line, a new aspect of your website, or to gauge their in-store experiences.
Running a successful fashion business is not all about the numbers; staying on top of trends, finding new supplier and pleasing customers can be a full time job. However, any business decision needs to be a mix of industry experience and hard data. The reports we have explained above will empower you to react before problems occur, refine your product mix faster than your competitors and don’t require you to becomes an Excel master.