
We all want the best for our customers – it’s why we invest so much in customer support and are constantly looking for ways to improve it. We know it has the power to convince an unsure browser or deter a lifelong supporter, which is why it’s so important to get it right.
But how do you know when you’ve nailed it or failed it? After all, you can’t experience your business from the customer’s perspective.
eCommerce customer experience KPIs can give you an understanding of what your business is like from the buyer end, helping you to make improvements based on data rather than pure guesswork.
There are a variety of KPIs you could dive into and, depending on the time and resources available to you, it’s worth getting stuck into as many of these as possible. For those needing a concise list, however, we’ve selected nine KPIs to start tracking today.
What are KPIs?
Key performance indicators (KPIs) are specific metrics about your business that show where it’s succeeding and where there’s room for improvement. These can cover a range of factors, from your social media marketing to the success of the products you have on offer in brick-and-mortar stores.
KPIs are particularly useful when evaluating your eCommerce customer experience as more and more people now shop and browse online. If you want to stay relevant in the current market, your eCommerce has got to be high-quality – and that includes the customer experience.
Tracking the following KPIs can show where your eCommerce is falling short and even give hints as to how to fix it.
1. First Response Time
Unsurprisingly, this KPI concerns how long it takes your customer service team to respond to a customer inquiry or issue. 18 percent of customers expect a response on social media within an hour, with a further 37 percent expecting a response sometime that day. The longer a customer waits, the more negative they’ll perceive their experience to be.
Calculate your first response time by using timestamps on communications, so you and your customer service team can see how long a customer query has been waiting. Find the average wait time of all first responses by adding response times over a certain period together and dividing them by the number of queries raised.
Ensure you have a well-equipped team who are able to handle the number of queries or issues raised. Additionally, for SMEs, looking for wireless business phone with integrated tools that connects employees and customers without delay is crucial in business success. A low first response time shows your team is efficient and wants to resolve questions quickly.
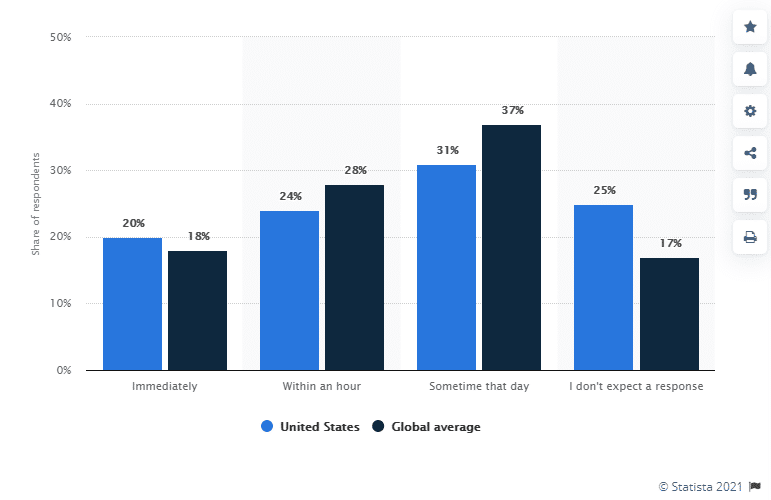
The expected response time for social media questions or complaints.
2. First Contact Resolution Rate (FCR)
Similar to the previous KPI, your first contact resolution rate is to do with quickly responding to and resolving customer queries. By measuring the number of queries resolved during the first interaction, via chat pop-ups or VoIP phone services, you see the ability of your staff to share their knowledge and understanding of your products and services comprehensively and efficiently.
Keep track of how many queries or issues you resolve within the first contact, as well as how many contacts it usually takes your team to achieve this. You can do this by labeling queries with the number of contacts taken to resolve or moving completed queries into a folder or group depending on whether they were resolved in one go.
To improve this KPI, regularly hold training sessions and provide opportunities for customer service staff to brush up on their product and company knowledge. You can also design contact forms in such a way that the customer clarifies and includes a handy amount of detail regarding their issue, so you don’t waste contact time working out what the problem is.
3. Customer Effort Score (CES)
Another essential metric to have under your belt is how much effort your customers have to put into a task. Whether that be searching for an item, raising a query, or making a purchase, the easier these processes are, the smaller the chance of customer pain points arising. Easy processes happen without noticing, while difficult ones can lead to complaints and bad reviews.
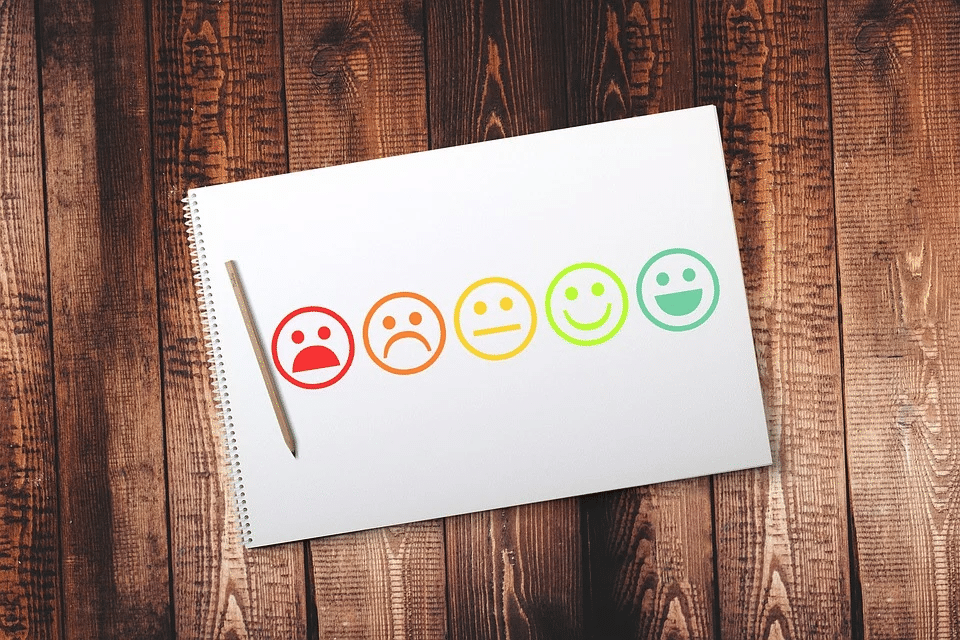
Set up surveys or questionnaires at key points in the customer journey to review the effort it has taken. Make questions specific to a particular part of the customer experience, especially when installing a new procedure. Even something as simple as a chatbot asking for a smile rating on finding what you’re looking for can give you this data.
Avoid asking for unnecessary details and, where possible, have the option to auto-fill information. Make sure your eCommerce website is organized clearly, making products and contact details easily accessible. Include as much helpful information as possible in product descriptions, so the customer isn’t wasting time searching for what should be easy answers.
4. Conversion Rate
As much as we love browsers, buyers are the ultimate goal. Your conversion rate will clarify how many of your website visitors go on to make a purchase. If you have a high conversion rate, you’re doing something right – clearly, there’s very little stopping your customers from making purchases. If your conversion rate is low, it might be time to reevaluate your customer experience.
Work out the ratio of visitors to your website versus those who make a purchase. Often websites have insights available that can inform you of this. If not, you can set up extensions to collect this data. You might also want to track specific factors that affect conversion rates, such as time of day, offers available, or interactions with customer services.
Identify if your low conversion rate correlates with cart abandonment. If loads of people are putting things in their cart, they must have intended at some point to make a purchase. This would suggest the issue resides at the payment end of the customer experience.
Perhaps use a process workflow to look at ways to improve this. Pinpoint where you’re going wrong and you can work out how to get it right.
5. Churn Rate
Churn isn’t good for anyone, but though it’s painful to see, it can be really helpful as a customer service KPI. It’s essentially the number of customers that leave your company after you’ve interacted with them. There are many reasons for churn, and working out what these are allows you to reduce them.
Choose a period and divide the number of customers lost by the total number of active customers. Making contact with recently active customers through different channels like SIP calls can remind them you’re there and prevent them from churning. Active customers are those who show interest, not just anyone who finds themselves on your website.
Notice the patterns in churn. Is it at a specific point in the customer experience, a particular time of year, or linked to something else entirely? Making contact with recently active customers can remind them you’re there and prevent them from churning. If this doesn’t work, it’s likely your churn rate signifies a deeper problem that needs to be addressed.

6. Favored Communication Channel
A bit of observation regarding where your customers are and how they communicate with you can go a long way. There’s no point in putting loads of effort into a channel none of your customers regularly use. Likewise, being where your customers already are takes a lot less effort from you and makes customers more likely to instigate communication.
Use social media metrics, such as number of followers, likes, and mentions to find out where the majority of your customers are active. Similarly, look at the number of interactions through other channels, such as your website, data from your business telephone company, and emails sent directly to members of your team.
Prioritize staffing the communication channels that are most used and make sure they work effectively. Designate automated responses to those channels less used, directing customers either to your knowledge base or website.
Streamlining communications by using an omnichannel approach can put everything in one place and simplify communications from the business end, meaning whatever customers use, all messages end up in your inbox and are seen.
7. Net Promoter Score (NPS)
Word-of-mouth recommendations are the best marketing for your business – they might even be better than your SaaS marketing plan! Net promoter scores give you an idea of how your business is being spoken about. High scores show people are not only talking about your business but acting as advocates, giving friends and family recommendations they’ll take seriously.
Using a survey or questionnaire, ask customers how likely they’d be to promote your business. Asking more specifically about a product or area of the customer experience can give you a specialized analysis of how willing customers are to promote you. However, take the results with a pinch of salt as, generally, customers exaggerate their hypothetical actions.
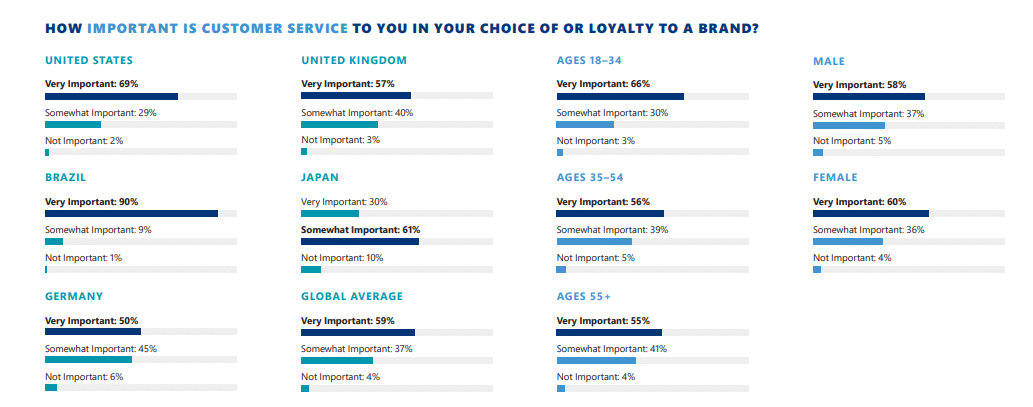
96 percent of people say customer service plays a part in the brands they choose and are loyal to. To get that loyalty, you can’t just cover the bases but must regularly provide an above and beyond customer experience.
Consider the features of your customer experience that set it apart from similar brands. Is it 24-hour customer service availability, incentives, or rewards for repeat customers, or perhaps taking action on social issues?
8. Customer Satisfaction Score (CSAT)
At the end of the day, all these KPIs are measuring how satisfied customers are with their experience of your business. This metric cuts to the chase and allows them to rate their satisfaction. It can be used for specific parts of the customer experience as well as in general, allowing you to see what you’re doing well and what could do with a brush-up.
Ask customers to rate their satisfaction with various areas of the customer experience. Higher response rates rely on you asking these questions right after interactions with customers and at key points in the customer journey. Alternatively, send a follow-up email after a purchase has been made to get a more holistic overview of the whole experience.
Satisfactory is not good enough. A middle rating can feel fairly safe, but all it takes is one dodgy experience for a customer to lose loyalty and find someone else. Use an automation software test to run through products and/or services and ensure all customer-facing features are working as they should be. There’s no room for error when it comes to your CSAT.
9. Repeat Customer Rate (RCR)
If you’re managing to not only attract but keep customers coming back to you, you’ve mastered the customer experience. Repeat customers are cheaper and likely to spend more with your business. There’s also a greater chance they’ll recommend you to their peers. This metric shows your customers trust your brand to deliver time and again.
Take note of the purchases made by repeat customers. This can be easily done where customers have to sign in, allowing you to see the number of purchases per account. Alternatively, track where the same addresses are used multiple times or use low code no code web page add-ons and insights to find the number of views or clicks per visitor.
Provide offers and incentives for previous customers to come back for more. Subscription services and memberships can get customers to commit to your business and continue shopping with you. Make sure the customer experience you offer is worth coming back for.

Get Tracking Those KPIs
Each KPI has benefits and limitations, but they’re all there to give you a clearer insight into the customer experience. To evaluate specific areas of this, certain KPIs will be more useful than others. While you could dive into a never-ending whirlpool of metrics and statistics, the nine above are the most important.
Once you’ve analyzed this data, act on it. It’s great knowing your areas for improvement, but if you do nothing about it, the problem is only going to get worse. Don’t be afraid to switch up something that isn’t working. Who knows what eCommerce growth the future could hold?