Retailers today face the constant challenge of balancing stock across multiple channels and locations without eroding profit margins. Inventory analytics helps solve that problem by using data to pinpoint performance, forecast demand, and sharpen replenishment. Since inventory is the primary driver of cash flow and customer satisfaction, mastering these insights is essential.
This guide explains how to leverage analytics to turn inventory data into a powerful and actionable strategy.
Key Takeaways
- Inventory analytics helps inventory managers understand which products are selling, where inventory performance is lagging, and how to improve stock decisions.
- Consistent inventory analysis supports improved demand forecasting, replenishment cycles, cash flow management, and customer service.
- Success requires a mix of high-quality data, relevant inventory metrics, and repeatable inventory management processes.
- Common barriers to success include siloed business systems, poor data visibility, and difficulty turning raw data into actionable insights.
- Modern technology and data analytics platforms connect data across all sales channels to automate faster and more accurate inventory decisions.
- Brightpearl enables businesses to operationalize these insights through real-time visibility and advanced retail reporting and analytics.
What Is Inventory Analytics?
Inventory analytics is the systematic process of collecting, analyzing, and interpreting inventory-related data to guide business decisions by generating a clear understanding of how inventory items move through your supply chain. While standard inventory management tells you how much inventory you have on hand, the use of analytics in inventory management explains how those inventory levels are actually performing for your business.
Retailers use these insights to identify patterns in consumer behavior and warehouse operations, such as calculating sell-through rates or pinpointing why certain items reach excess stock levels. This shift allows you to use predictive insights to adjust your inventory planning before issues impact your bottom line. Ultimately, transforming raw data into a strategic asset helps you optimize stock levels and improve overall profitability.
Inventory Analytics vs. Inventory Reporting
It is important to distinguish between inventory reporting and inventory analytics. Reporting shows what happened in the past, such as a static inventory dashboard showing current stock levels or a summary of last month’s sales. Inventory management analytics, on the other hand, involves analyzing data to explain the “why” and the “what next.” It interprets the data to explain performance trends and recommends specific inventory decisions to take. Because analytics is more decision-oriented than traditional methods of reporting, it gives your team the confidence to make changes that directly improve your inventory turnover rate.
Why Inventory Analytics Is Important for Retailers and E-commerce Brands
Inventory analytics serves as the strategic foundation for modern retail success. By switching to data-driven decisions, you can align your stock levels with actual market needs and operational realities.
Inventory management analytics helps retailers and e-commerce brands:
- Improve product availability: Better insights help you avoid stockouts and missed sales on high-demand items. You can identify which products are vital inventory and ensure they are always ready for order fulfillment.
- Reduce excess inventory: Analytics highlights slow-moving stock before it ties up too much of your working capital. This helps you avoid high storage costs and the need for heavy markdowns later.
- Support healthier cash flow: Effective inventory management directly impacts your cash flow. By optimizing what you buy and when, you ensure your money is invested in products that generate cost savings and high returns.
- Strengthen forecasting: Analytics helps you make informed decisions regarding seasonality, promotions, and shifting demand patterns. This leads to more accurate demand forecasting and fewer surprises during peak seasons.
- Improve customer experience: Real-time data visibility supports faster fulfillment and more reliable shopping experiences. When you meet customer expectations for availability, you improve long-term loyalty and customer satisfaction.
- Enables better decision-making: Your team can make confident choices when they have access to current, high-quality data. Whether it is evaluating supplier performance or adjusting pricing, data provides the necessary evidence for action.
What Data Powers Inventory Analytics?
Useful inventory analytics depends on having complete and connected data from every corner of your retail operation. When your data sources are siloed, your insights will always be incomplete, which can lead to errors in purchasing or fulfillment.
For a successful inventory analysis, you’ll need:
- Sales and order data: Your transaction history helps you understand demand velocity and individual product performance across different periods.
- Current stock data: Accurate stock levels across all stores, warehouses, and fulfillment locations are essential for a reliable inventory analysis.
- Warehouse and location data: Knowing how inventory moves through your warehouse helps you identify bottlenecks in your warehouse space and fulfillment workflows.
- Supplier and purchasing data: Tracking lead times and supplier performance helps you refine your replenishment strategies and manage vendor relationships.
- Returns data: Analyzing returns allows you to see how product quality or sizing issues affect your true demand patterns and future inventory needs.
- Channel performance data: It is vital to understand how inventory behaves differently on your website compared to marketplaces like Amazon or physical retail locations.
How Inventory Analytics Works
Inventory analytics is not a one-time project, but an ongoing cycle that shifts with your business. By following a repeatable workflow and emphasizing continuous improvement, you can refine your inventory management processes and adapt to changing market trends.
1. Collect Inventory Data
The process begins by gathering raw data from all your business systems. This typically includes your point-of-sale (POS) systems, e-commerce platforms, warehouse operations, and retail accounting software.
2. Organize and Unify the Data
To gain a complete picture, you must centralize data from multiple channels and locations. Unifying this information ensures you are analyzing a single version of the truth rather than conflicting reports from different apps.
3. Analyze Trends and Performance
Once the data is organized, retailers review specific inventory metrics and KPIs. You look for patterns in customer behavior, such as seasonal spikes in demand or a declining inventory turnover ratio, to understand how your stock is moving.
4. Act on the Insights
The final step is turning analysis into action. These actionable insights should directly influence your purchasing orders, promotional strategies, and long-term inventory optimization goals to improve your bottom line.
Types of Inventory Analytics
To get the most value from your data, it helps to understand the different questions you are trying to answer. These categories of analysis provide a framework for how you view your stock performance and plan for the future.
Descriptive Analytics
This type of analysis focuses on what has already happened in your business. It covers essential metrics like current inventory levels, historical sales trends, and sell-through rates to provide a clear picture of your past performance.
Diagnostic Analytics
Diagnostic analytics helps your team understand why specific stock issues occurred. If you experienced a sudden stockout or a spike in excess stock, this method digs into the raw data to find the root cause, such as a supplier delay or a shift in consumer behavior.
Predictive Analytics
How predictive analytics works is by using historical data and machine learning to estimate future demand. By looking at past patterns, you can forecast demand for upcoming seasons and identify potential inventory risks before they manifest.
Prescriptive Analytics
This is the most advanced level of analytics, as it recommends specific actions based on the data. For example, it might suggest the exact time to reorder a specific SKU or recommend transferring stock between warehouses to meet localized demand patterns.
Common Inventory Analytics Methods Retailers Use
Practical techniques help retail teams apply analytics to their daily operations. These methods turn high-level data into manageable tasks that improve inventory flow and accuracy across the supply chain.
ABC Analysis
This method involves segmenting your inventory items into three categories based on value and turnover. “A” items are your high-value products that require close monitoring, while “C” items are low-value goods that may not need as much attention.
Demand Forecasting
Forecasting involves estimating future sales patterns using historical data and market trends. It is a critical part of inventory planning that helps you stay ahead of customer needs without overcommitting your budget.
Trend Analysis
Trend analysis helps you identify recurring patterns over long periods. By spotting these cycles, you can better prepare for seasonal shifts or identify when a once-popular product is starting to lose its appeal.
Inventory Segmentation
Beyond ABC analysis, you can group products by margin, seasonality, or channel performance. This allows you to tailor your inventory strategies to the specific needs of different product categories.
Exception-Based Analysis
This approach allows your team to focus on unusual changes, such as a sudden dip in stock levels or an unexpected spike in returns. It highlights issues that require immediate human intervention to prevent disruptions.
Comparative Analysis
Retailers often compare performance across different SKUs, warehouses, or sales channels. This helps you identify which parts of your business are most efficient and where you should hold inventory to maximize margins.
Inventory Analytics KPIs to Track
You do not need to track every possible metric to be successful. Instead, focus on a mix of inventory metrics that align with your specific business model, such as average inventory and turnover speed.\
Examples of KPIs you might want to track include:
- Inventory turnover ratio: This shows how many times you have sold and replaced your inventory during a specific period. A higher inventory turnover rate typically indicates strong sales and efficient stock management.
- Sell-through rate: This compares the amount of inventory you received against what was actually sold. It is a great way to measure the success of a specific promotion or product launch.
- Stockout rate: Tracking how often items are unavailable helps you protect your revenue, avoid missed sales, and improve customer satisfaction.
- Days on hand: This tells you how long your current inventory is expected to last based on your average inventory and sales velocity.
- Inventory holding costs: Understanding your storage costs and insurance expenses helps you see the true cost of keeping excess stock in your warehouse space.
- Gross margin return on inventory investment (GMROII): This vital metric connects your inventory investment to your actual profitability, showing the gross margin return for every dollar spent on stock.
- Backorder rate: A high backorder rate often reflects a supply-demand imbalance that needs to be addressed through more accurate demand forecasting.
- Return rate: High return rates can skew your demand patterns, so ongoing monitoring helps you plan your inventory more accurately.
- Forecast accuracy: Measuring how close your predictions were to reality helps you refine your inventory planning for the future.
Common Inventory Analytics Challenges
Even with the best intentions, retailers often face hurdles when trying to implement a data-driven strategy. Recognizing these challenges is the first step toward building a more resilient operation.
Disconnected Systems
Many retailers struggle because their inventory data lives in separate systems that do not talk to each other. Pulling data manually from different apps is time-consuming and often leads to errors.
Poor Data Quality
If your SKU data is inconsistent or your stock updates are delayed, your analytics will be unreliable. High-quality data is the essential “fuel” for any analytics platform.
Limited Real-Time Visibility
Delayed insights reduce your agility in a fast-moving market. If you are looking at week-old data, you may already be too late to respond to a sudden shift in customer demand or supply chain disruptions.
Overreliance on Spreadsheets
Manual processes and complex spreadsheets create risk and slow down your decisions. As your business scales, these traditional methods often become a bottleneck for growth.
Difficulty Turning Insights Into Action
Many teams can see the numbers but lack the workflows to act on them quickly. Without automation, insights often sit on an inventory dashboard instead of driving real change.
Scaling Across Channels and Locations
The complexity of managing inventory across e-commerce, marketplaces, and physical stores makes it difficult to maintain a unified view of performance as you grow.
Best Practices for Using Inventory Analytics Effectively
To get the most value from your data, you should treat analytics as a core part of your retail culture. These practices help ensure your insights lead to measurable improvements in your performance.
Start With Clear Business Goals
Tie your analytics to concrete outcomes, such as reducing stockouts by a certain percentage or improving your cash flow. Having clear goals keeps your team focused on what matters most to meet customer demand.
Focus on the Most Useful KPIs
Avoid overwhelming your staff with too many vanity metrics. Choose a few key indicators that truly reflect your operational efficiency and financial health.
Standardize Inventory Data
Consistent product and inventory records are the foundation of good analysis. Ensure your SKUs and descriptions are standardized across all business systems to prevent confusion.
Review Performance Regularly
Inventory needs shift over time, so you should review your data frequently. Weekly or monthly check-ins allow you to catch trends early and adjust your inventory strategies accordingly.
Use Analytics Across Teams
Visibility should not be limited to inventory managers. Merchandising, finance, and shipping and fulfillment teams all benefit from having access to shared real-time data.
Combine Insight With Automation
Analytics is most valuable when you can make informed decisions and act on them immediately. Connecting your insights to one central platform allows you to trigger reorders or updates without manual effort.
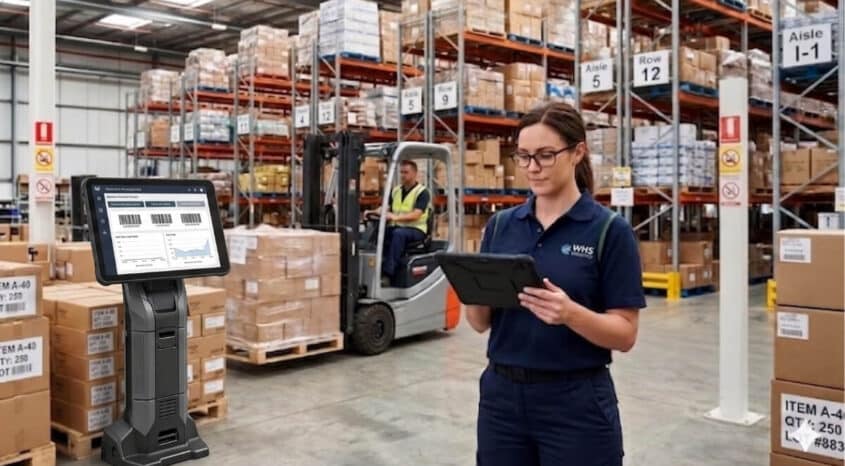
How Technology Improves Inventory Analytics
Modern retail technology provides the tools and capabilities needed to make inventory analytics actionable at scale. Instead of fighting with spreadsheets, you can rely on analytics platforms designed for the complexities of multi-channel commerce.
- Real-time data visibility: Current data is essential in retail. Technology ensures you are making decisions based on what is happening right now, not what happened yesterday.
- Centralized reporting: Unifying your inventory views across all stores and warehouses allows you to manage your entire business from a single platform.
- Automated analysis: Software reduces the manual effort required to calculate complex metrics like gross margin return or turnover rates, giving your team more time for strategy.
- Alerts and exception management: Technology can automatically flag low stock levels or excess inventory, allowing you to intervene before issues escalate.
- Cross-channel insight: Understanding how your stock performs across different sales channels helps you allocate inventory where it is most likely to meet customer expectations.
- Scalability: A robust system grows with you, providing real-time insights and making it easier to manage more SKUs and locations without increasing your administrative burden.
How Brightpearl Helps Retailers Turn Inventory Analytics Into Action
Brightpearl is a retail-focused platform built specifically to help merchants move beyond fragmented data and manual processes. It connects your sales, inventory, and fulfillment activity in real time, giving you a unified view of your entire operation. By integrating all your channels into one system, Brightpearl helps you overcome the challenges of disconnected data and delayed visibility.
The platform provides several key advantages for retailers who want to operationalize their inventory analytics:
- Real-time inventory visibility: Track stock levels across all your channels and locations automatically to ensure accuracy and reduce excess stock levels.
- Retail-first reporting: Access intuitive retail reporting and analytics features that support faster, more confident inventory decisions.
- Automation for operational workflows: Use the built-in automation engine to act on your insights, such as triggering replenishment when stock hits a certain threshold.
- Multi-channel support: Unify your operations across e-commerce, physical retail, and marketplaces like Amazon or eBay to better meet customer demand.
- Improved replenishment and planning: Make more informed purchasing decisions based on actual sales velocity, historical data, and lead times.
- Operational efficiency at scale: Manage the complexity of a growing business without the need for a massive team or traditional methods like spreadsheets.
Brightpearl helps you combine deep inventory insight with swift action. It ensures that your data is not just something you look at, but a tool you use to drive your business forward.
Turn Inventory Data Into Smarter Retail Decisions
Inventory analytics is about much more than just reporting; it is about empowering your retail business to make smarter, faster, and more profitable decisions. By understanding the “why” behind your stock performance, you can optimize your inventory levels, improve your cash flow, and ensure your customers always find what they need. The most significant gains occur when you combine high-quality data with the right KPIs and a connected technology platform.
Ready to improve how your business uses inventory data? Book a demo to see how Brightpearl helps retailers gain real-time visibility and make smarter inventory decisions.
Frequently Asked Questions
What is inventory analytics?
Inventory analytics is the process of using inventory data to understand product performance, improve stock decisions, and forecast future demand. It helps retailers optimize their stock levels to improve cash flow and customer satisfaction.
What are the 4 types of analytics?
The four types are descriptive (what happened), diagnostic (why it happened), predictive (what might happen), and prescriptive (what action to take). Most successful retailers use a combination of these to manage their operations and meet customer expectations.
What is the 80/20 rule in inventory?
Also known as the Pareto Principle, the 80/20 rule in inventory suggests that roughly 80% of your revenue often comes from just 20% of your inventory items. Identifying these top-performing products helps you prioritize your purchasing and management efforts.