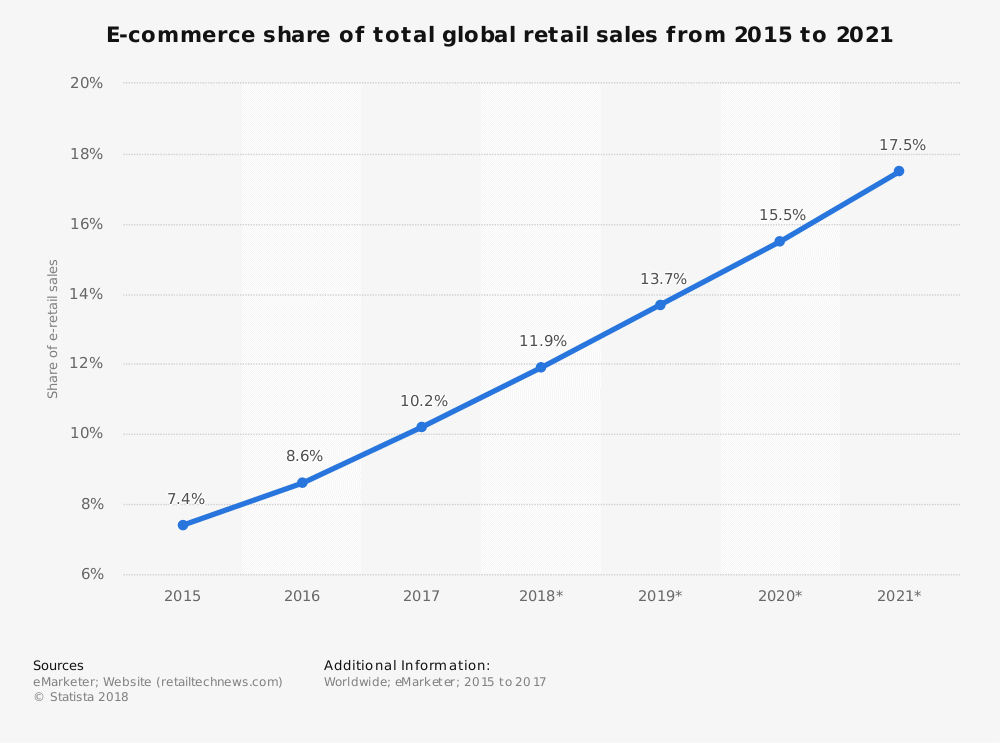
Ecommerce is huge, and growing steadily bigger by the year. As technology and innovation in delivery channels improve, more and more people are turning to online ecommerce stores as an alternative to physical stores. Online business is certainly here to stay.
With cloud-based computing continually evolving, staying abreast of new developments can be overwhelming. And with increased need for data security, companies can often be hesitant when it comes to new development.
In 2019, global ecommerce business saw a total revenue of USD 3.53 trillion. Projections have that figure reaching USD 6.54 trillion in 2022. Some projections say that by 2040, 95% of all purchases will be made online.
People are spending more time—and money—at online stores than ever before, and how they access enhanced ecommerce sites is changing, too. It is estimated that 73% of all ecommerce activity will come from mobile devices by the end of 2021.
With such a large and ever-growing market, competition is also increasingly fierce. So it is essential for ecommerce businesses to get their service right and to maintain high levels of customer satisfaction. To do that, you need to be sure that your ecommerce website is operating at optimal levels. And to do that, you need to be able to accurately analyze its performance.
But analyzing your website’s performance on various levels can be no easy task. You want a general overview of the analytics as well as more focused snapshots of specific areas of performance. Knowing this can lead to better performance and optimization of your site.
Improving your business means having all the tools you need to improve the customer journey and to maximize revenue. This can include anything from the best inbound call center software, utilizing companies such as SD-WAN vendor Infovista or even integrating Live Chat into your website.
We look at four of the best user-focused analytic tools that will help you improve analysis, performance, and efficiency.
What is Ecommerce Website Analytics?
It is useful to know exactly what ecommerce analytics is and why it’s so important. Consumers are increasingly web-savvy and, just as they would shop around for good deals in physical stores, the same is true for online shopping.
Building a successful ecommerce business is not just about building a brand identity, it is about ensuring that people recognize that brand and enjoy engaging with it.
With the convenience of visiting different websites taking no more than the click of a mouse button, it is crucial that you stay on top of your game and ahead of the competition. A slow website, poor pricing, and a negative customer experience will lead to customers going elsewhere.
Ecommerce businesses rely on website analysis and ecommerce tracking to ensure they are operating at peak efficiency. Analytics tools analyze and test how your website is performing with the end goals of improving the customer journey and increasing your conversion rates and sales and revenue figures.
They can achieve this by providing you with two main types of ecommerce data:
1. Quantitative Data
The quantitative data you receive gives you an easy to read numerical measure of various metrics on your website. For example, you will be able to see the amount of daily visitors to your site, how many are regular or return visitors, and how much time they spend on your site and on specific pages.
2. Qualitative Data
This gives you more detailed information from your customers. This can come from sources such as customer surveys. These can identify common points of frustration your site visitors experience. It can also identify the positives that customers feel work well.
By combining results from both sets of data, it makes it easier for you to see where there are issues on the site (such as a slow-loading landing page). You can then adjust and tweak those areas to improve the customer experience. And then monitor the next cycle of data to see if those adjustments have led to tangible improvements.
It is also important to ensure that you are analyzing the correct ecommerce metrics in relation to your business model. The data you analyze has to be relevant to what you sell and how you operate.
Which Metrics Should You Analyze?
Efficient businesses move with the times. They install new systems, they change ways of doing things, they adapt to new technology. A few years ago, the question “what is a teleconference?” would have been met with blank stares, but it is now part of how we do business.
Before you consider what analytics tools will be best for you, you need to be sure of what metrics and KPIs you are looking to measure and analyze. While there may be a core set of common metrics important to every business, you may want to look at certain focused metrics. We look at the eight of the most important:
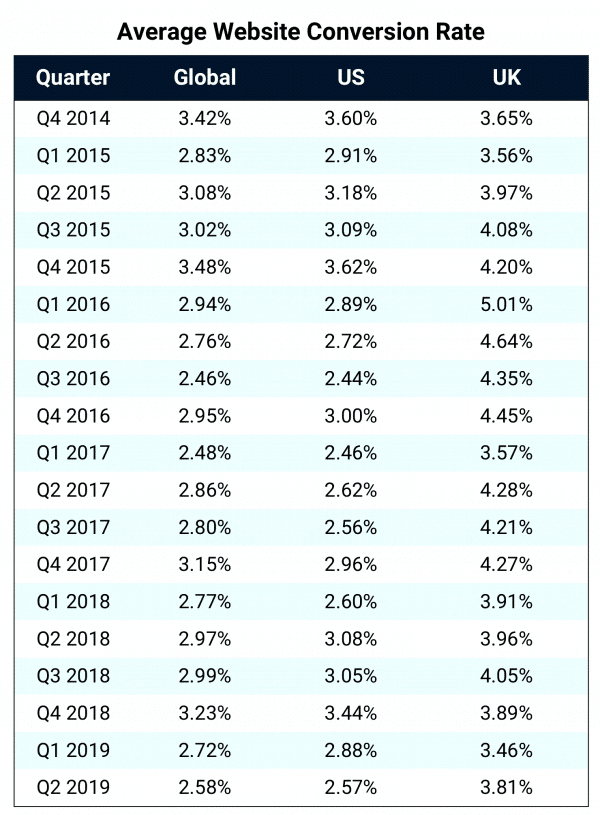
Conversion Rate
A simple to understand metric, this simply refers to the % of customers who make a purchase after visiting your site. Averages for ecommerce sites vary from around 2% to 5% so this is what you should be looking to achieve or even outperform.
Email Campaign Signup
Email marketing remains a powerful marketing tool with an extremely high ROI. In an ideal scenario, you want website visitors to sign up to your mailing list even when they do not purchase anything on that visit. You want to be able to track the ratio of visitors to sign-ups and you also want to track their source or referral point.
Lifetime Value
This metric tracks the revenue you receive from a customer over their total or current lifetime. If, for example, you earn $50 over five transactions by a customer, then their customer lifetime value (CLV) is $250. There are different ways to calculate this, so look at what your chosen analytics tool offers you.
Acquisition Cost
Of course, there are costs involved in every new customer you attract. This is known as the customer acquisition cost. Your profitability in this area depends on your customer acquisition cost (CAC) being less than your CLV. And your CAC should also be less than the site’s average order value.
Sources
In the world of ecommerce, not all traffic is created equal. Some sources may direct traffic to your website in large numbers but those numbers see low conversion rates. Another source may send lower numbers but with much better ecommerce conversion rates.
Quality is more important than quantity and knowing which source is best allows you to direct your spending to the sources providing quality customers.
Average Order Value
Another simple metric that shows you the average value of each purchase. To calculate, divide your total sales figure by number of transactions. You can drive this metric up by looking at packages, special offers, offering free shipping at a certain spend level, etc.
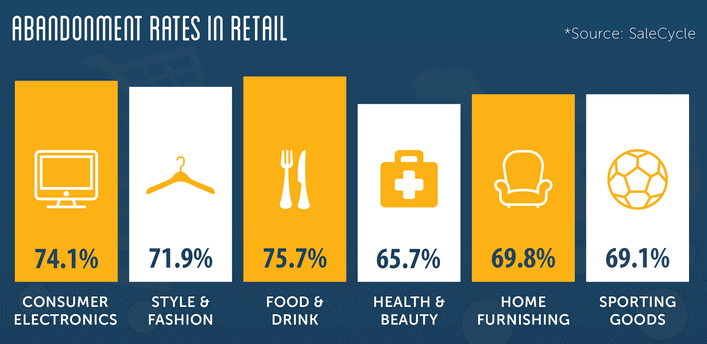
Abandonment Rate
This metric tells you about the number of visitors who have added items to their shopping cart but left the site without finishing the purchase at checkout. Abandonment during the checkout process can happen for a number of reasons but identifying that you have a high rate allows you to examine any issues in closer detail.
NPS (net promoter score)
Another simple metric that tells you how satisfied customers are with your service. There are usually two questions asked that give you an NPS: ‘How likely is it that you will recommend us?’ (on a scale of 1—10). And ‘Why did you give that score?’.
User-Focused Tools for Ecommerce Analytics
Ideally, you want to use the tools and programs that make your business more efficient. Ask yourself questions for each part of your company. What solutions for cloud computing companies could improve how we operate? What is cobrowsing and could we use it to better train our staff on new tools? And what tools will best help us analyze our website data?
So, now we know the primary metrics that we want to analyze in order to improve how our ecommerce website performs overall. But what tools should we choose in order to get a well-rounded analysis that actually benefits us?
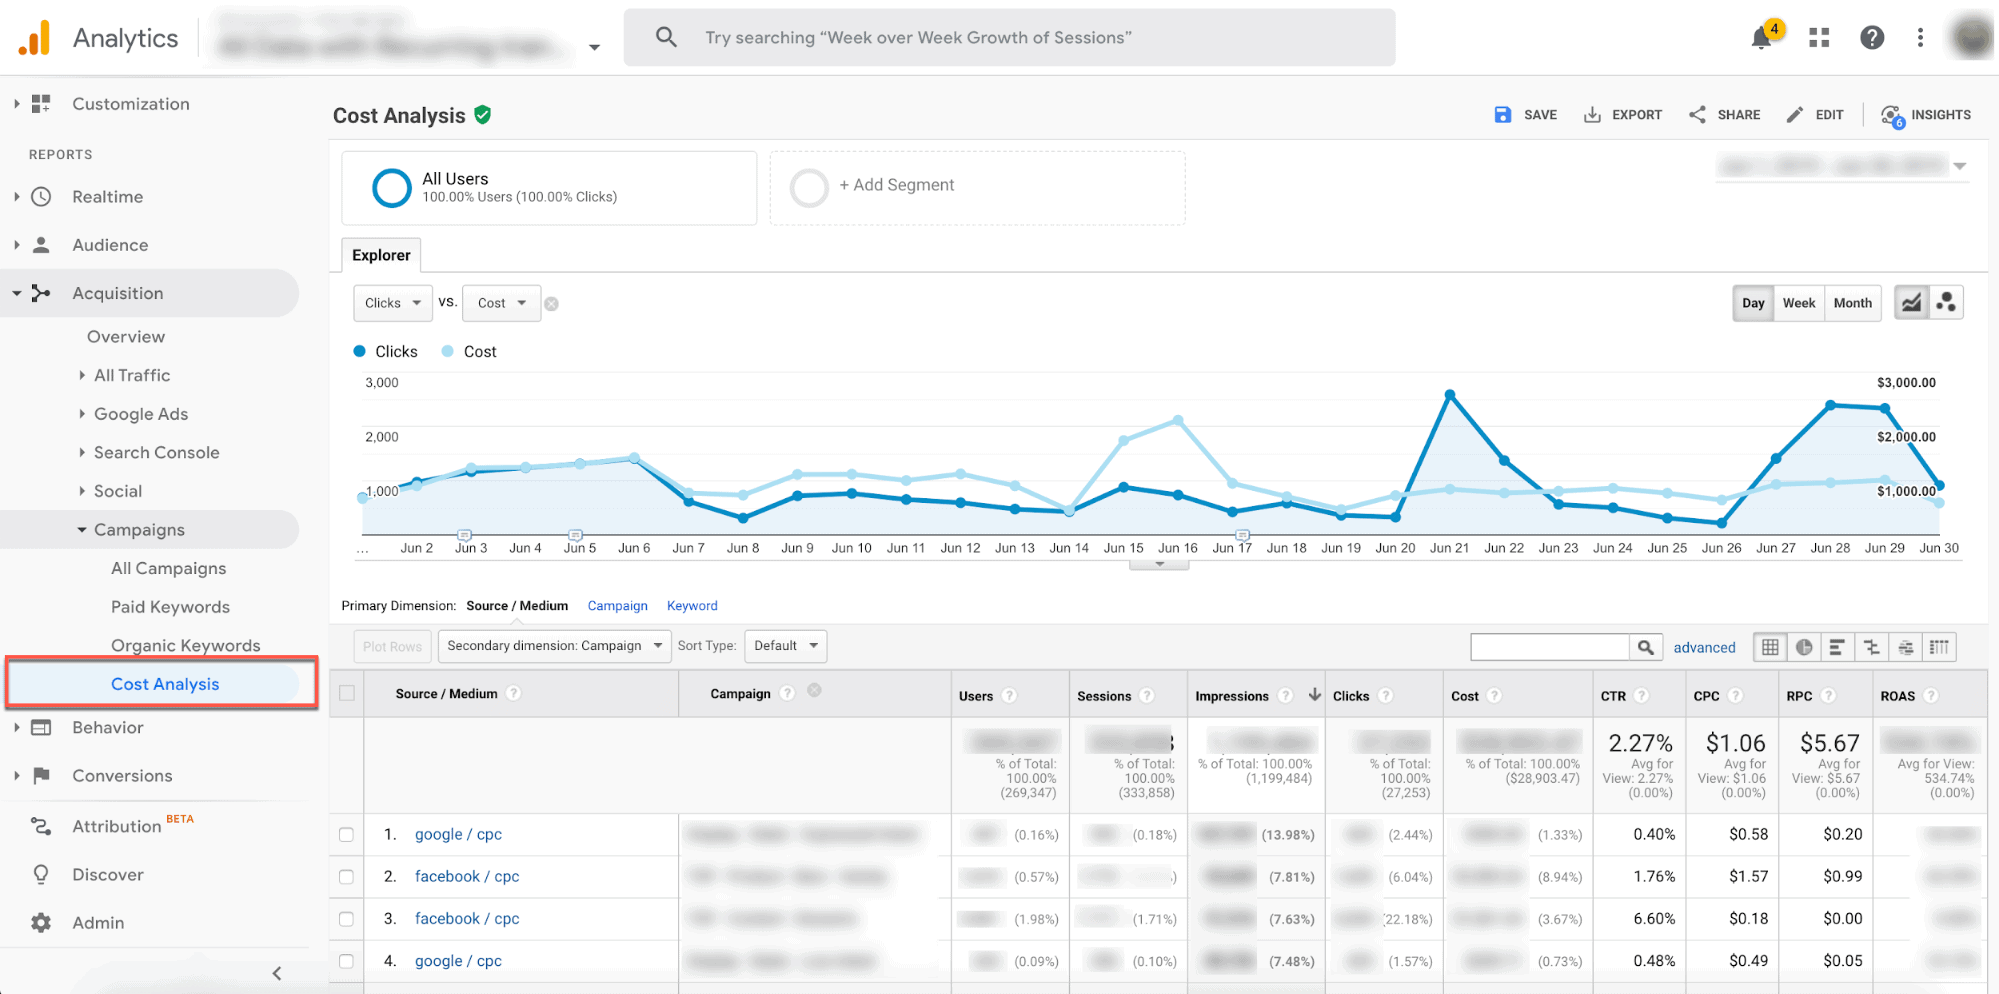
1. Google Analytics
Google Analytics remains one of the most-used tools for businesses. There are a number of reasons so many ecommerce businesses use it. First and foremost of those is that it is free. This allows you to invest in other areas of your system and infrastructure.
It also collects your data automatically and transfers it to report formats. You can choose to use their own report formats or customize your own template. GA also integrates easily with other tools. This is especially true if you use Google Adwords as the two will link together and work to improve any Adwords campaigns. It uses tracking codes to send data to reports quickly, too.
This integration can be useful when linking up with project management software, so that you can combine several different views into one vision.
GA offers tracking regarding what customers do once on your site, what they search for, and what landing pages they visit. And if you are experiencing high bounce rates, GA will provide detailed reports on what pages and sections of your site are most affected.
Demographic data can play a big part in marketing campaigns and marketing strategy, and GA offers this in droves. It can identify age, gender, interests, location, and what devices they are accessing your site from. It can also help you to identify what social media platforms will most benefit you when it comes to the placing of ads and content.
GA is useful when it comes to attribution models that will assign credit for any of your sales or conversions to the relevant points in the conversion process.
Your content can play a major role in how well users engage and GA will highlight content and SEO terms that leads to high engagement and that which has lower levels. And, you can customize GA to identify different goals you want to set such as conversion rates, opting into email marketing lists, etc. This can be of enormous benefit to your marketers.
2. Brightpearl
Brightpearl offers a deep and insightful analysis of many aspects of your ecommerce business. Its analytics are data-driven and are ideal for any business whether at retail, wholesale, or brand level. It can report on everything from customer behaviors and patterns through to detailed financial reporting and in-depth analysis and reports of your inventory.
What items are selling quickly and which are not performing as well? Brightpearl gives you clear reports on these aspects of your stock. This allows you to plan and make adjustments to your portal to push the slower moving products.
The management analytics give you instant access to all your crucial metrics, and can be looked at as a whole or broken down into more focused reports on your different channels, products, and even your customer segments. This gives your 360 degree visibility and the ability to see reports on revenue, average order values, profitability, and inventory.
Brightpearl allows you to take data isolated in silos and change it into opportunities, by reporting on all your key metrics at every level from category to stock-keeping. At a glance, you will see what are your best and worst performing products. You can also analyze how your marketing and promotions are affecting sales, so that you see the big picture of your sales performance.
Of course, one crucial requirement you need from your analytics is detailed understanding of customer behavior. Brightpearl allows you to see overall behavior or to zoom in on specifics. Identify sources and referral points, what sales channels they are using, what categories or products they are browsing and buying, and how often they visit and purchase.
The outstanding analytics offered by Brightpearl allow you to both make new long-term marketing plans and strategies, and to tweak and adjust in real-time. With the ability to focus on any portion of your business, you can be sure that all actions based on the insights gleaned will pay dividends.
3. Crazy Egg
Crazy Egg offers deep and insightful views into customers’ journeys, so you can make changes to improve those journeys. Crazy Egg is used by over 300,000 websites and can help you make changes that matter to you in design, content, images, and even colors.
Crazy Egg uses a number of visual reports and recordings of individual sessions to let you know where visitors are coming from, what landing pages they are visiting, and what is causing them problems if any. It also provides detailed heatmaps so that you can see what areas of your site are attracting visitors and are performing well.
Making decisions about changes that are based on data can have a positive effect on your eventual bottom line. Crazy Egg’s A/B testing analyzes and reports on how your site looks to visitors and how you can better convert them to customers.
Another great feature of Crazy Egg is its simple-to-use editor. This allows you to change colors and fonts with virtually no effort, or even hide/remove them. With a few minutes of work, you can then publish any changes straight to your webpages.
Crazy Egg is easy to set up and also integrates simply with services such as Shopify. You can also add all members of your team to the system for free. One of the beauties of Crazy Egg lies in its initial simplicity. You can get started quickly then customize as you move forward.
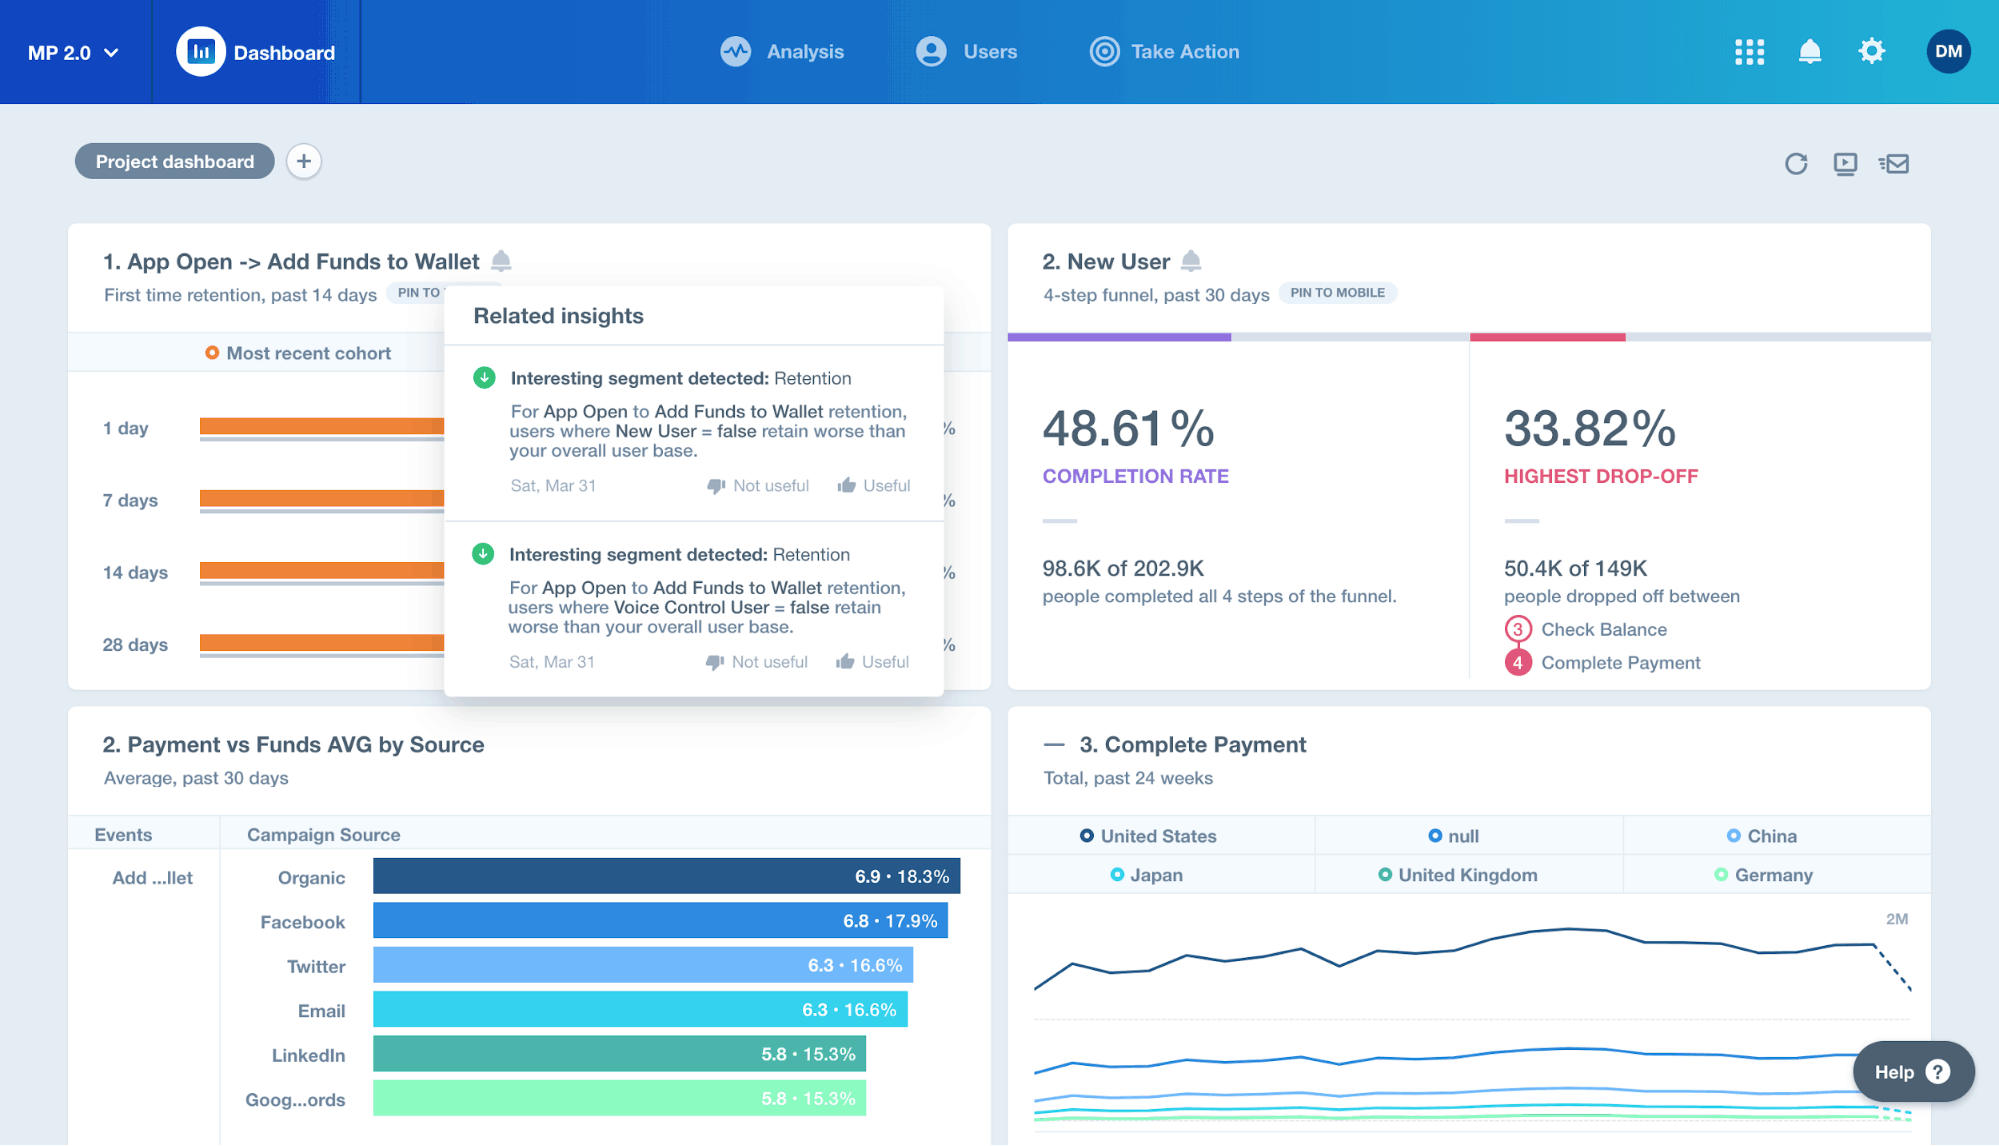
4. Mixpanel
Mixpanel is a great analytical tool that helps you to grow your business by focusing on and analyzing how your customers behave and interact with all your ecommerce platforms. It can help you engage with current and new users, convert visits to sales, and work on long term customer retention. Its clientele includes major global players such as Samsung and BMW.
Powerful analysis and interactive ecommerce reports are two of the main features that make Mixpanel so attractive to companies. You can investigate data with only a few clicks and see visualizations that make them easy to understand. This allows you to see who is using your site, levels of engagement, and it quickly identifies areas where adjustments may be needed.
Mixpanel lets you break down customer actions into segments that let you make meaningful decisions. You can group your key users by what they buy or how much they spend (your power users). You can also monitor and analyze any trends that occur, from landing pages visited, to how special offers or discounts perform.
Knowing which site visitors make actual purchases and what influences that decision is crucial to planning any changes. Mixpanel allows you to build funnels in real-time that show user behaviors and attributes. It also shows any components of your funnel that is causing issues so that you can raise engagement levels.
Mixpanel allows for the ideal mix of marketing management and project management. It can help combine lots of different snapshots into one clear picture.
The Takeaway
When it comes to making planning decisions for your ecommerce site, being able to access and interpret the relevant data is essential. Nobody gets things right the first time and using a good analytics platform can help you see what works and what doesn’t. You want your investment in both infrastructure and marketing efforts to give good ROIs.
Before making a decision as to what tool will be of most help, you should list the primary and secondary metrics that you want to analyze. You may also want one that can analyze data across several of your marketing channels. This will play a big part in choosing a particular analytical program.
As the ecommerce market continues to grow, so will the need for good analysis and reports to influence the decisions you make. Take some time to see what fits your needs and requirements and then look to see if trial or free versions are available to test them out.
What looks good on paper—or screen—may not always be the best choice for you. While many people saw Zoom as the go-to program for video conferencing, now there are 10 powerful Zoom alternatives for video calling and conferencing available. It is the same with analytics tools.


