The inventory forecasting process is crucial for your business, but is a bit of a balancing act. You’ll want to purchase enough inventory to keep up with customer demand and reduce the risks of overselling or running out of inventory, while not tying up too much cash within your warehouse due to reordering too early.In this chapter, we’ll discuss the different inventory forecasting methods your business can use, and show you how to forecast inventory accurately with inventory forecasting best practices.
What is Inventory Forecasting?
Inventory forecasting is the process of predicting how much stock will be required to meet expected product demand. Essentially, it’s used by e-commerce and traditional retailers to decide how much they’re likely to sell over a specific period of time. They can then identify the optimum time to replenish stock levels, and the optimum amount to order.
Forecasting involves bringing together data from multiple sources. This includes historic and real-time sales figures, general market trends and customer behaviors, and external factors like supply chain issues or weather events. There’s also a certain amount of guesswork, but the more information you have, the more accurate the prediction should be.
Of course, nobody knows exactly what’s around the corner (take the global pandemic as a recent example), so good inventory forecasts should be agile enough to allow for adjustments as and when necessary. That’s why many businesses use advanced inventory control software with built-in demand planning.
The Five Main Inventory Forecasting Methods
When building reliable forecasts, businesses can choose from a range of methods depending on the data available, the level of detail required, and the specific goals in mind. Below are some of the most widely used forecasting approaches:
Trend forecasting (top-down, bottom-up)
Trend forecasting examines long-term patterns in data to predict future outcomes. The top-down approach starts by analysing the market as a whole and then narrowing down to a company’s share or segment, which is useful for businesses aligning with broader industry movements. The bottom-up approach, on the other hand, begins at the product, service, or departmental level and builds upward to form an overall forecast, offering more granular insights rooted in operational realities.
Graphical forecasting
Graphical forecasting uses visual tools like charts and graphs to spot patterns, outliers, or shifts in data. This approach is particularly useful for identifying relationships that may not be obvious in raw numbers, making it easier for decision-makers to interpret complex information and communicate forecasts across teams.
Qualitative Forecasting
Qualitative forecasting relies on expert opinions, market research, and informed judgement rather than numerical data. It is especially useful when historical data is limited, such as during new product launches or when exploring emerging markets. Techniques may include Delphi panels, focus groups, or scenario planning.
Quantitative forecasting
Quantitative forecasting applies mathematical and statistical models to historical data to project future outcomes. This approach is most effective when large, reliable datasets are available. Methods include time series analysis, regression models, and econometric forecasting, all of which provide objective, data-driven insights.
Seasonality forecasting
Seasonality forecasting focuses on recurring patterns within specific time frames — such as months, quarters, or holidays — to predict future demand or performance. It is particularly valuable for industries affected by seasonal cycles, like retail, tourism, or agriculture, where planning around peaks and troughs is essential for efficiency and profitability.
Key Benefits of Inventory Demand Forecasting
Inventory forecasting helps businesses maintain lean operations and manage their cash flow effectively, by keeping just the right amount of stock on hand at all times. Here are some more advantages:
Reduces manual labor
As well as using data to predict peaks and troughs in demand, inventory forecasting helps you to manage your labor more efficiently. As you’ll be aware of seasonal spikes and emerging sales trends, you can schedule extra staff to work at busy times—and save money by operating a skeleton crew when it’s quiet. Plus, if you only carry the exact amount of inventory you need, you’ll save on manpower to handle it.
With an automated inventory management system, your back-office staff won’t need to spend hours sifting through data and manually calculating forecasts. The machines will do the hard work in making predictions, as well as automatically ordering new stock from the most suitable supplier when it runs low. With inventory forecasting taken care of, there’s more time to spend on things like marketing and customer service.
Lessens stockout possibilities
Accurate inventory planning helps you to guard against the possibility of stockouts, which could prove catastrophic for your business. If you don’t have enough inventory to fulfill customer demand, those customers will quickly head elsewhere, never to return. And if you’re scrambling to order extra stock from whichever supplier has it on hand, you won’t be able to negotiate on price.
Inventory forecasting is a critical part of planning, as it lets you predict demand. By checking which products are top sellers, and which times of year see a spike in sales, you can figure out how much of each item to order—and when is the optimum time to do it.
Increases product cycle management efficiency
In combination with inventory tracking, forecasting helps you identify which products fly off the shelves and which ones sit there for months. This helps you make better decisions about the product life cycle, including streamlining your offering by dropping unsuccessful products.
Once you’re confident in your predictions, you’ll be better placed to choose suitable suppliers who can meet the expected demand. Strong communication with suppliers also enables you to understand the production cycle and adjust your forecasts when necessary, factoring in potential delays in the global supply chain.
Prevents unnecessary inventory purchases
Having too much inventory can be just as disastrous as having too little. For one thing, it takes up a lot of space in your warehouse, and makes it harder for employees to locate the right items for picking. The longer goods are stored, the more they’re at risk of damage, spoilage, or theft—or becoming obsolete as customers move on to the next trend. You’ll either have to sell them at a discount, or pay to recycle or dispose of them.
However, with an accurate inventory forecast, you can prevent this scenario from happening as you’ll know the right time to replenish your stock. You could even reduce your overheads by adopting the Just-In-Time inventory model, in which stock is ordered only when it’s required (so it arrives just in time to fulfill the customer order).
Cost savings (bulk ordering vs. excess stock)
Accurate forecasting helps businesses strike the right balance between bulk ordering for discounts and avoiding excess stock that leads to waste or storage costs. By knowing when and how much to order, companies can take advantage of supplier incentives without tying up resources in unnecessary inventory.
Customer & supplier satisfaction
Reliable forecasts ensure products are available when customers need them, reducing the risk of stockouts and lost sales. At the same time, suppliers benefit from more predictable order patterns, strengthening long-term relationships and supporting smoother supply chain operations.
Cash flow benefits (releasing cash tied up in excess inventory)
Holding too much inventory can restrict cash flow, preventing businesses from investing in growth opportunities. Forecasting reduces surplus stock and frees up working capital, allowing organisations to channel resources into areas like marketing, product development, or technology upgrades.
Quick response to supply-chain changes
With accurate forecasting in place, businesses are better equipped to adapt quickly to disruptions such as supplier delays, shifts in demand, or global market fluctuations. This agility ensures continuity of service and helps maintain a competitive edge.
How to Forecast Inventory Demand
There’s a lot to consider when it comes to demand forecasting, but here are some basic steps to get you started:
Select the forecast period
The forecast period is the specific amount of time you want to cover with your predictions. You could choose to make forecasts for the coming year, quarter, month, or week. Whichever way, don’t just create the forecast and assume it will stay relevant for the entire period. You’ll need to review it regularly to check whether sales performance differs from what you expected—and make adjustments if so.
Check the current situation
How much stock do you currently have on hand? What are your current reorder points, and have you already placed orders for more inventory? What is the lead time from each supplier? You’ll need the answers to these questions before you start forecasting.
Identify base demand
Base demand is the exact current demand for a product, as it stands at the specific point the forecast is due to begin. For instance, let’s say you want to run a quarterly (90-day) forecast for football jerseys. If you sold 127 jerseys over the previous quarter, then your base demand would be 127.
Know your customer
When you have a good understanding of your customers and their shopping behaviors, this will help with forecasting. You can use information from your CRM, past sales data and customer service interactions, market research, and social media activity. You should already have the data on hand, but an automated system like Brightpearl will collate it for you and feed it into the forecast.
Consider the variables
There are a great many variables that make forecasting difficult, and you need to take these into account in order to achieve the most accurate predictions. Some of these are connected to your own activities. For example, if you just launched a marketing campaign or a special promotion, you can expect a spike in sales. Seasonality (e.g., demand for Halloween products) is also a known factor.
There are plenty of external variables to consider, too. A new competitor might arrive on the scene and steal your trade, or a similar firm may go under and their customers will flock to you. A celebrity influencer might start a new trend that sees people rushing to copy it. Supply chain delays caused by bad weather or a shortage of raw materials could lead to low stocks.
Keep it flexible
Your forecasts need some wriggle room so that you can adjust them on the fly. It’s worth working with your suppliers to develop contingency plans, and creating a few different forecasting models and scenarios to get an idea of what might happen “if”.
Enabling Automated Inventory Forecasting
Automated forecasting tools gather the relevant data from all your sales channels and inventory locations, analyze it, and present you with a report. Brightpearl’s Demand Planner lets you factor in fluctuations, prioritize your most profitable products, and even create purchase orders direct from your replenishment report.
You’ll still need to keep an eye on the data and make adjustments if there’s an unexpected uptick or downturn in sales. Any forecast will always be an estimate, not an absolute guarantee of what’s going to happen (if we could do that, we’d use it to predict the lotto numbers!). But it removes a lot of the guesswork from inventory forecasting.
Steps to Creating Inventory Forecasts in Excel
Although spreadsheets can only take you so far in terms of efficient inventory management, there are a number of specific Excel formulas for inventory forecasting. You can customize the forecasts by selecting a start date, factoring in seasonality, and changing the dates on your timeline. Excel can fill in missing data by calculating the weighted average of the nearest points available.
You can also customize the appearance of cells to help identify trend patterns, while the chart function creates useful graphs and charts. We’d still recommend something a bit more advanced, but if you do want to create an inventory forecast in Excel, here’s how:
- Collate all the historical data you want to use
- Create a new worksheet in Excel
- Arrange your data in columns. The first column will contain the date or time entries for the timeline. In the second column, list their corresponding values
- Highlight cells containing both data series
- Click the Data tab and select the Forecast Sheet icon in the Forecast group
- In the Create Forecast Worksheet box, choose the type of chart you prefer
- Pick an end date from the Forecast End box, then click Create
- Excel automatically opens a new worksheet with the historical and predicted values, and a visual representation.
Inventory Forecasting Formulas
Reorder Point Formula
By adopting inventory forecasting best practices, you’ll ensure you always have ‘just enough’ inventory on hand to meet demand, while avoiding tying up too much cash in your warehouse.
As part of the quantitative inventory forecasting method, it’s useful to calculate your reorder point for each product, which represents the level of inventory that should trigger a replenishment order.
Typically, in inventory management software, this reorder point is known as the “Min” as in “Min/Max” inventory.
To calculate what your optimal “Min” number should be, you can use the reorder point formula, which involves the following calculations:
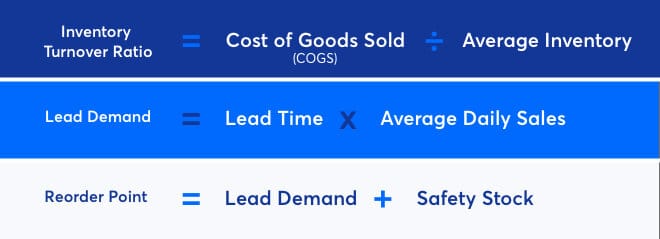
Establishing Your Reorder Point
Now that you’ve established how quickly you need to replenish your inventory, how long it takes for suppliers to deliver your goods and how much safety stock you need in your warehouse as a buffer, you’ll be able to establish your optimal reorder point using the following calculation:

As explained previously, your reorder point is the minimum quantity of inventory you want to hold in your storeroom or warehouse, so should the item fall below that threshold, you’ll be prompted to buy more inventory from your supplier.
Reordering is a bit of a balancing act as you want enough inventory on hand in order to cover your reorder lead time, without resulting in too much excess inventory from reordering too early.
By using the above calculation, powered by your lead time demand and safety stock figures, you should find that you get the balancing act just right for your business.
Did you know? With Brightpearl’s Inventory Planner, you can:
Determining Your Lead Demand & Safety Stock Figures
In order to determine your reorder point, you’ll need to know what your lead demand and safety stock values are, which are represented by the following calculations:
Lead demand (also called lead time demand) is the projected level of consumer demand for a product between now and the estimated delivery date from your supplier for a new replenishment order.
While lead time is the time it takes from the submission of a purchase order with your supplier to when the items are actually delivered to you.
Many suppliers will provide you with an estimated lead time, however, for the purposes of accurate inventory forecasting, it’s better to calculate your actual lead time. Based on your historical purchase order data, you should see an average length of time that suppliers take to deliver goods to you.
Safety stock is the additional inventory you hold in your warehouse to reduce the risk of overselling due to peaks in supply and demand. By using the simple calculation listed above, you’ll be able to hold the optimal level of safety stock – enough that you don’t oversell on fast-moving inventory, but not so much that you’re tying up too much cash in your warehouse.
Safety Stock Formula
Safety stock is an amount of extra inventory that you keep on hand as a buffer against stockouts. Hopefully you won’t need it, but it’s there in case there’s a problem such as unexpected demand or supply chain disruption. And you need to factor it into your inventory forecast.
To calculate the optimum amount of safety stock, you’ll need to know your average usage and lead time and your maximum usage and lead time:
Safety stock = (Max number of units sold in a day X max lead time for replenishment) – (average daily usage X average lead time in days)
Imagine you sell a maximum of 50 units per day, and the maximum lead time to replace them is 7 days. Average daily usage is 35, and average lead time is 4 days. Your calculation is:
(50 x 7) – (35 x 4) = 210
You need to ensure you always have 210 extra units on hand. However, the safety stock method is not suitable for every product type—for instance, perishable or very high-value goods.
Economic Order Quantity
Economic Order Quantity (EOQ) is a calculation for working out the most economical quantity of inventory to order for a specific product. The idea is to minimize the cost of warehousing and logistics, as well as preventing stockouts or excess stock.
This method relies on consistent data, so it’s best for companies whose levels of demand, ordering, and holding costs are likely to remain constant over time.
Demand represents the number of units sold over a given time period. Ordering cost is calculated per purchase order, including all the costs associated with making each PO. For the holding cost per unit, assume the item will be in stock for the entire time period.
EOQ = √ 2 X (demand in units X order costs per purchase) / carrying costs per unit
Let’s say you sell an average of 600 coffee mugs per year. The order cost is £5 per mug, and the carrying cost is £2 per unit per year. The calculation would be:
√ 2 x (600 x 5) / 2 = 54.7
So, the ideal number of mugs to order is about 55, assuming regular demand.
Inventory Turnover Ratio
Your inventory turnover ratio dictates how fast you’re selling your inventory, and thus, how often you need to replenish it.
The common calculation for your inventory turnover ratio is:

… which is usually based on 12 months’ worth of data.
As a basic example, if your annual sales totaled $500,000 and you held $75,000 worth of inventory last year, then your inventory turnover ratio would be 6.6.
In other words, you would need to replenish your inventory roughly twice per year.
Sales velocity
Sales velocity measures how quickly products move through your inventory over a given period. It highlights the speed of customer demand and is crucial for identifying fast-moving versus slow-moving items. A higher sales velocity indicates strong product demand, helping businesses prioritise reordering and reduce the risk of stockouts. On the other hand, low sales velocity can signal products that may become dead stock, tying up valuable capital.
Average inventory
Average inventory refers to the typical amount of stock a business holds over a set timeframe, usually calculated as the mean between beginning and ending inventory. Tracking this figure helps businesses understand whether inventory levels are too high or too low in relation to sales. Monitoring average inventory alongside sales velocity provides a clearer picture of efficiency, turnover rates, and working capital tied up in stock.
Quick inventory turnover tip #1:
To eliminate excessive inventory, ensure you have adequate forecasting that is specific to each SKU you use. If you just forecast based on your overall inventory balance, then you may not realize you have too much of one SKU and not enough of another SKU on hand.
Quick inventory turnover tip #2:
Compare your Average Days to Sell Ratio with how long it takes you to place an order for new products from your supplier. If you can get products from your supplier very quickly, then you can have a lower ratio and move closer to a just-in-time inventory model. This makes for great cash flow!
Note: Your lead time will vary for each of your suppliers, and possibly also for each SKU. Set your lead time at either a supplier or a SKU level, or both, to cover all your bases.
Automation of Inventory Forecasting
Modern inventory management systems use automation and AI-driven algorithms to analyse sales data, supplier performance, and market conditions in real time. Automated forecasting reduces human error, saves time, and allows businesses to respond quickly to demand fluctuations without constant manual updates.
Steps to Creating Inventory Forecasts in Excel
For smaller businesses or those just starting out, Excel remains a practical tool for building forecasts. The process typically involves gathering historical sales data, calculating averages or trends, applying formulas for seasonality or growth, and using charts to visualise outcomes. While manual, Excel provides flexibility for custom forecasting models.
Inventory Forecasting in Practice
Effective forecasting combines theory with real-world application. Businesses that regularly review forecast accuracy, adjust based on market signals, and integrate input from sales, marketing, and supply chain teams are more likely to maintain optimal inventory levels. Forecasting in practice is an ongoing process, not a one-off task.
Forecasting for seasonal products
Seasonal products require specialized forecasting to account for peaks and troughs in demand. Retailers, for example, must anticipate holiday spikes, while agriculture businesses plan around growing seasons. By layering historical seasonal trends with promotional calendars, companies can stock appropriately without over committing resources.
Forecasting for new product launches
New product launches often lack historical sales data, making forecasting challenging. In these cases, businesses rely on qualitative methods such as expert judgment, competitor benchmarks, or pilot sales data to estimate demand. Adjustments are then made once real sales patterns emerge.
Incorporating promotions into forecasts
Promotions can temporarily distort demand patterns, so forecasts must account for spikes caused by discounts, campaigns, or special offers. Analyzing past promotional events helps businesses predict the likely lift in sales and avoid either running out of stock or overstocking once the promotion ends.
Handling wild cards (market shocks, supplier delays)
Unexpected events — such as supply chain disruptions, economic downturns, or sudden market shifts — can make even the most accurate forecasts unreliable. Building flexibility into forecasting models and maintaining contingency plans, like safety stock or multiple suppliers, helps businesses respond effectively to these “wild cards.”
- Forecast inventory based on sales forecast, seasonality, inventory levels, supplier lead times and desired days of stock
- Receive reminder emails when items fall into low stock
- Setup automatic purchase orders
- Access inventory aging reports that highlight slow-moving items
- Access overstock reports that highlight where inventory is too high
- Run KPI reports for stock turn, sell through, stock cover, PO cover and sales velocity
Automated Inventory Forecasting
Automated inventory forecasting leverages technology to streamline demand planning and reduce manual errors. By integrating with an ERP (Enterprise Resource Planning) system, forecasting tools can pull real-time data from sales, purchasing, and supply chain operations. This centralized approach ensures that forecasts are always based on the most current information, improving both accuracy and responsiveness.
When selecting inventory forecasting software, businesses should look for:
-
ERP compatibility – seamless integration with existing systems for data consistency.
-
Real-time updates – automatic syncing with sales, supplier, and inventory data.
-
Customizable forecasting models – the ability to adapt methods for seasonal products, promotions, or new launches.
-
Scenario planning – tools to test “what-if” situations, like supplier delays or market shifts.
-
Ease of use and reporting – dashboards and visualize
By choosing software with these functionalities, companies not only improve accuracy but also gain agility in adapting to market changes, supporting better decision-making across the entire supply chain.
FAQs on inventory forecasting
What is the difference between inventory forecasting and replenishment?
- Inventory forecasting is the process of predicting future demand using historical sales, market trends, and other influencing factors. Its purpose is to estimate how much stock will be needed over time.Replenishment, on the other hand, is the operational step that follows forecasting. It refers to the act of ordering and restocking inventory based on forecasted needs. In short, forecasting is about planning demand, while replenishment is about executing supply.
What are some inventory forecasting best practices?
-
Use accurate data – Base forecasts on clean, reliable sales and inventory records.
-
Combine methods – Blend qualitative insights with quantitative models for stronger accuracy.
-
Factor in seasonality and promotions – Adjust forecasts for recurring peaks or one-off events.
-
Review regularly – Forecasts should be updated frequently to reflect new data or market changes.
-
Align teams – Involve sales, finance, and supply chain teams to create a shared and realistic forecast.
What is the 80 20 rule in inventory forecasting?
(explain the implications)
-
The 80/20 rule (Pareto Principle) in inventory forecasting suggests that roughly 80% of a company’s sales often come from 20% of its products. This means not all items deserve the same level of forecasting attention.
Implications:-
Businesses should focus on accurately forecasting their “vital few” products that drive the majority of revenue.
-
Less critical products can be forecast with simpler models or managed with higher safety stock.
-
Prioritizing top-performing items improves overall efficiency, reduces risk, and ensures that resources are directed where they matter most.
-
Further Reading
Ultimate Guide to Inventory Forecasting
by Inventory Planner